
As discussed in the previous article, flow cytometers have been developed through the convergence of various scientific technologies. By enabling the collection of information at a scale beyond the resolution of conventional microscopy, they allow for the detailed analysis of both surface and intracellular characteristics of individual cells. This has made flow cytometry an essential analytical tool across many areas of biology.
While Part 1 explored the basic components of a flow cytometer, today’s article will focus on how data can be extracted using these components. We will also review various biological markers that can be observed through flow cytometry and summarize how these markers can be applied in biological research.
Principle of flow cytometry
1) Fluorescent staining
Each fluorescent molecule has a specific range of wavelengths at which it can absorb light energy. When the molecule absorbs light, its electrons are excited from the ground state to a higher-energy excited state. As the excited electrons rapidly return to the ground state, the excess energy is released in the form of light photons. This emission of light resulting from the energy transition is what we refer to as fluorescence.
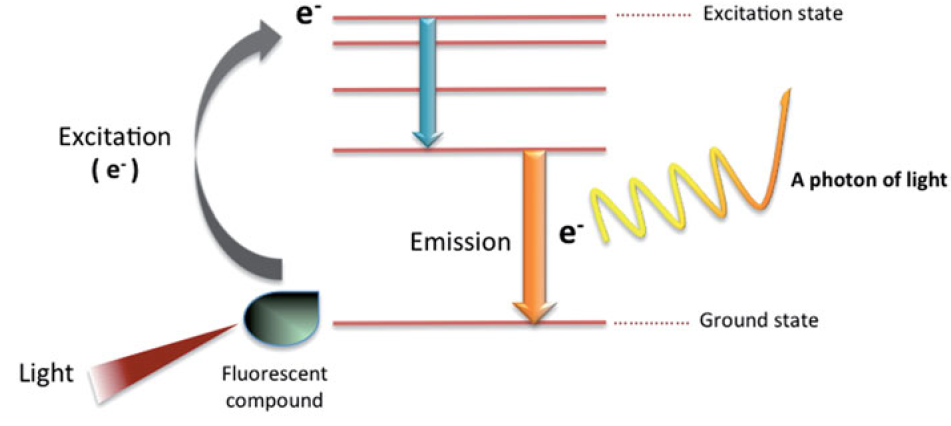
The wavelength of light emitted during this process is always longer than that of the absorbed light. The difference between the maximum absorption and emission wavelengths is known as the Stokes shift. This shift is an important criterion for evaluating the quality of fluorescent dyes. The larger the Stokes shift, the greater the separation between the excitation and emission wavelengths, which minimizes signal interference and makes the dye more suitable for analytical applications.
When fluorescent molecules are conjugated to specific proteins or other targets, they can be used to visualize cell surface receptors or intracellular organelles. This allows for the distinction of cell populations based on differences in protein expression levels, as well as the measurement of cellular phenotypes, nucleic acid content, or enzyme activity. By using multiple fluorescent dyes with different emission wavelengths simultaneously, it is possible to label and detect up to 14 different proteins in a single experiment.
2) Flow cytometry using fluorescent staining
Fluorescent dyes used in flow cytometry can be classified into protein stains, nucleic acid stains, and reporter molecules.
First, fluorescent dyes for staining proteins are conjugated to antibodies that bind to the target proteins. The most commonly used fluorescent dyes for antibody labeling are FITC, PE, and APC. Choosing the most suitable fluorescent dye according to the target molecule and the laser installed in the flow cytometer is a very important point in flow cytometry. For example, if you use a flow cytometer equipped with an argon ion laser, FITC can be used as a basic fluorescent dye.
FITC readily reacts with lysine residues in proteins and forms a stable conjugate. Its excitation wavelength is 490 nm, making it a good fluorescent dye for single-color staining. However, because of its relatively long emission wavelength at 520 nm, FITC is not suitable for multicolor staining together with other fluorescent dyes. FITC fluorescence is also very sensitive to pH and vulnerable to photobleaching. To overcome these drawbacks, various FITC-based derivatives have been developed that are more stable under different conditions and exhibit increased fluorescence intensity, enabling better protein detection.
PE (495 nm excitation, 565/578 nm emission) and APC (650/660 nm) are types of phycobiliproteins, which are components of photosynthetic systems. Their absorption and emitted fluorescence intensities are relatively high. The fluorescence intensity is about 30 times stronger than fluorescein such as FITC, but in actual staining, PE and APC show fluorescence about 5 to 10 times stronger than FITC. When using an argon laser, both FITC and PE can be excited, but APC requires a helium-neon laser to satisfy its high excitation wavelength of 650 nm. However, a downside of phycobiliproteins is their high molecular weight, which may cause structural changes when conjugated to proteins, and insufficient washing during staining can lead to high background signals.
The development of tandem dyes combining two fluorescent substances has created various methods for protein labeling. A representative example is FRET (fluorescence resonance energy transfer) complexes that combine PE or APC with various cyanine dyes. FRET works by the first dye absorbing light and transferring the emitted energy to the linked fluorescent molecule, enabling sequential absorption and emission. This produces a large Stokes shift and broadens the range of fluorescence detectable by a single laser wavelength.
Nucleic acids can also be visualized through fluorescent staining. Fluorescent staining is used to measure DNA content, assess nuclear membrane integrity, or confirm ploidy and cell cycle. The most commonly used nucleic acid dye is PI (propidium iodide), which intercalates between DNA bases and emits red fluorescence upon excitation by blue light. Another dye, 7-AAD, is advantageous for detecting GC-rich DNA and is used to stain dead cells because live cells can remove 7-AAD. Hoechst and DAPI dyes absorb UV light and bind to AT-rich regions of DNA. Although they are membrane-permeable dyes, dead cells tend to take them up more easily.
Reporters are also frequently used in flow cytometry. GFP is a fluorescent protein that absorbs light at 488 nm and emits green fluorescence. GFP variants are used to sort cells expressing GFP. Another reporter, JC-1, is used to measure mitochondrial membrane potential; it accumulates and forms aggregates inside healthy mitochondria, emitting fluorescence at 590 nm.
Analysis and Application of Flow Cytometry Data
1) Data analysis
The process of analyzing flow cytometry data to visualize the target of interest is one of the important steps in biological research. The main goals of data analysis are to selectively reveal the characteristics of the target cells and to extract quantitative information about those cells. This type of data analysis is called gating. A gate is a user-defined region on a dot plot that allows analysis of only the cells possessing the targeted characteristics.
Subpopulations of cells classified by gating are separated by numerical or graphical boundaries, and these classified cells are visualized using various types of plots. For example, regions specified on a histogram can be represented on a 2D plot such as a dot plot, contour plot, or probability density function plot, or even as a 3D plot like a surface graph.
The most representative graph with a single parameter is the histogram. The x-axis shows the signal intensity of the parameter, while the y-axis represents the number of events for each signal value. Moving rightward along the x-axis corresponds to increasing signal intensity, and ideally, the data shows a single distinct peak. However, depending on the distribution of cell subpopulations, the histogram may show multiple peaks.
For graphs with two parameters, each parameter is plotted on the x- and y-axes, and the number of cells is shown by dot density or contour lines. In a dot plot, each dot represents a single event corresponding to the values of the two parameters. A probability density function plot shows the frequency distribution of the two variables, with color indicating the density. Contour plots are similar to probability density function plots but differ in that they use contour lines instead of colors to represent density.
2) Data application
By utilizing such flow cytometry data, various cellular characteristics can be analyzed, making it frequently used in life science research fields such as immunology. Most notably, immunophenotyping or general phenotypic analysis helps identify and quantify specific cell populations when cell types are mixed. After conjugating antibodies to specific proteins on the cell surface—commonly used markers—and performing fluorescent staining for these proteins, gating based on marker expression enables quantitative analysis of the target cell population.
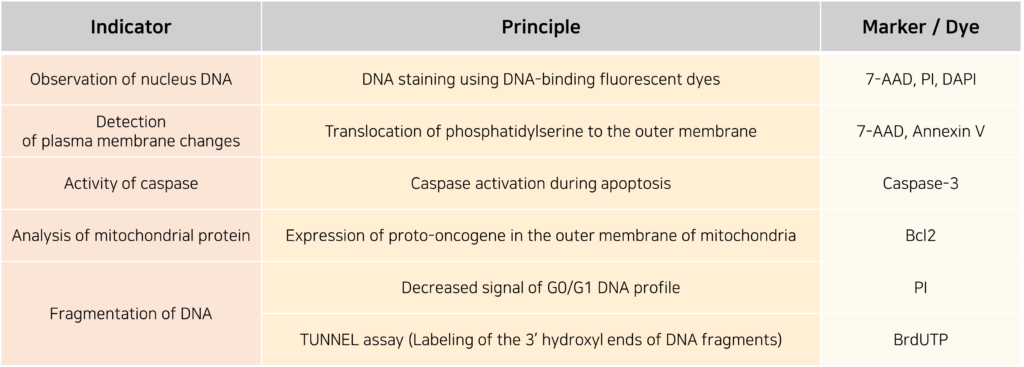
Additionally, this data can be used to calculate the number of dead cells by employing various indicators to measure cell viability. The measurement methods used for this purpose are as follows.
Flow cytometry data, which can be utilized in various ways as described above, has established itself as a highly efficient analytical method because it allows the analysis of large numbers of cells in a short time and enables the simultaneous investigation of multiple characteristics. Beyond the basic experimental and analytical methods introduced here, recent advances in quantum dots, microfluidics, and the development of spectral flow cytometry have made more precise cell analysis and classification possible. Given the numerous research findings revealing new cell types, as well as the need for more accurate evaluation of pharmaceutical efficacy, the use of such advanced flow cytometers is expected to be a valuable alternative.
Reference : Adan A, Alizada G, Kiraz Y, Baran Y, Nalbant A. Flow cytometry: basic principles and applications. Crit Rev Biotechnol. 2017 Mar;37(2):163-176. doi: 10.3109/07388551.2015.1128876.