As the therapeutic functions of extracellular vesicles (EVs) are gradually being elucidated, research is being conducted to utilize them as therapeutic agents. However, unlike antibodies, peptides, and chemical compounds, EVs are not composed of a single component, and as they are derived from biological sources, their composition can vary. Additionally, due to the complexity of their composition, it is difficult to quantify them using a single fixed quantification method, posing challenges for their pharmaceutical application.
Therefore, in order to quantify and characterize EVs, it is necessary to employ not only conventional standard quantification methods but also advanced modern technologies. Furthermore, rather than relying on a single analytical method, a comprehensive approach that combines multiple analytical techniques is required for accurate EV analysis.
This article aims to summarize various quantification methods for EVs and the techniques used to analyze their compositional characteristics.
- EV Quantification methods
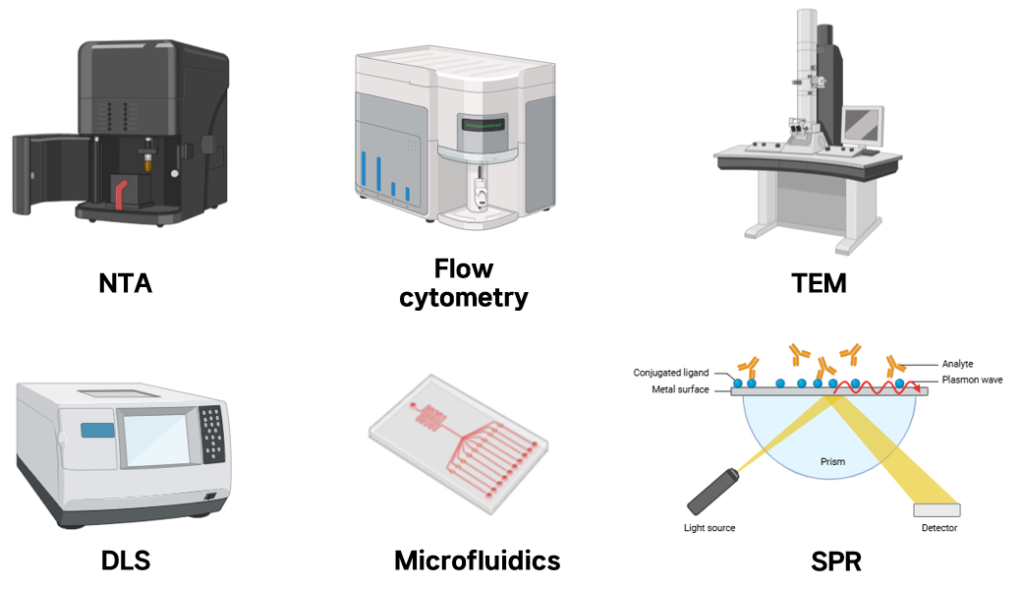
1) Nanoparticle Tracking Analysis (NTA)
NTA measures the concentration of particles by detecting light scattered by suspended particles based on Brownian motion principles. It is the most commonly used device for measuring EV count. The principle involves irradiating exosomes suspended in the sample with a laser beam, capturing the scattered light using a CCD camera, and analyzing the recorded footage.
The Stokes-Einstein equation is applied to calculate particle concentration from the recorded footage, and the results are expressed as particle count per cubic centimeter. Since NTA does not require a preprocessing step and directly analyzes the sample, it is useful for confirming and calculating EV counts. When using the fluorescence mode, EVs without fluorescent labels are not detected, allowing for specific EV quantification. However, since the particle size detection range is limited to 30-500 nm, EVs larger than 500 nm, such as apoptotic bodies, cannot be measured, enabling differentiation between larger vesicles and EVs.
A drawback of NTA is that lipoproteins of similar size can be counted alongside EVs, affecting the results. Additionally, obtaining reproducible results requires high-end equipment and expertise, posing a knowledge barrier. Moreover, issues such as photobleaching of fluorescent dyes and background signals can introduce uncertainties in analysis results. Therefore, precise and rigorous measurement according to established guidelines is essential when using this equipment.
2) Flow cytometry
Flow cytometry, widely used in many laboratories, can also be employed to measure EVs, as it allows simultaneous analysis of multiple parameters. However, due to limitations in size measurement, conventional flow cytometers cannot detect particles smaller than 300 nm.
To quantify EVs smaller than 300 nm, antibodies can be utilized. This involves binding EVs to beads, attaching fluorescently labeled secondary antibodies, and injecting the beads into a detector in a single-particle state. When the laser irradiates the beads, the fluorescence is activated and detected by the fluorescence detector, and the fluorescence intensity is used to count the number of events, corresponding to the EV count.
However, a major challenge in EV quantification using flow cytometry is that the sample temperature increases during the analysis, which can alter the state of EVs and affect the results. Additionally, small particles may aggregate and be counted as a single event, leading to underestimation, especially when particle concentrations are high.
3) Tunable Resistive Pulse Sensing (TRPS)
TRPS detects specific particles by utilizing voltage across a membrane pore. When EVs are placed on one side of the membrane, single-particle EVs move towards the pore, causing a rise in pore resistance and a subsequent decrease in internal current. The number and size of particles passing through the pore are determined by analyzing changes in current. An “event” is defined as a 1-microampere drop in current, and the event count is converted into EV concentration.
However, repeated use of this technology can lead to pore blockage, and its low sensitivity makes it difficult to detect smaller exosomes.
4) Electron microscopy (EM)
The most direct method to confirm the purity and integrity of isolated EVs is through electron microscopy. To visualize EV morphology using electron microscopy, whole-mount negative staining is performed during sample preparation. However, this process can cause EVs to dry and take on a cup-shaped morphology. To avoid such morphological changes, imaging can be performed using cryo-transmission electron microscopy (Cryo-EM). Other preparation techniques, such as blocking sectioning, plastic embedding, and glutaraldehyde fixation, can preserve the original morphology of EVs for observation.
5) Dynamic light scattering (DLS)
DLS is widely used for measuring nanoparticle size, similar to NTA. Particles in solution undergo Brownian motion, randomly colliding and exchanging energy. When light is scattered by particles in all directions, the intensity of scattered light detected at a specific angle is used to calculate particle size and concentration. The faster a particle moves, the more unstable the scattered light intensity appears. The Stokes-Einstein equation is applied to determine particle size, and a polydispersity index (PDI) of less than 0.1 indicates uniform particle size in the sample.
6) Microfluidics
Microfluidic devices allow precise control of fluid volume from microliters to milliliters through micron-scale channels. They serve as tools for quantifying and analyzing EVs derived from various sources, including cell culture media and patient-derived fluids. By using a programmed pump system, immunocaptured EVs are counted to calculate yield. This technique requires minimal sample volume, making it practical, cost-effective, and intuitive. The high sensitivity of this method has been validated through experiments demonstrating its ability to analyze and quantify miRNA within EVs.
7) Surface plasmon resonance (SPR)
SPR detects particles without requiring special labeling by utilizing resonant electron oscillations caused by a refractive index mismatch between a material’s surface and incoming light. This method is commonly used to study biomolecular interactions. For EV quantification, an SPR sensor detecting anti-CD63 antibodies can be employed to measure concentration. The margin of error for measurements obtained using this technique has been found to be approximately ±50%.
8) Single-particle interferometric reflectance imaging sensor (SP-IRIS)
SP-IRIS allows multiplex phenotyping and digital counting of distinct populations of EVs larger than 50 nm. The IRIS signal, after bouncing off the SiO₂ layer, is affected by interference from the fields. SP-IRIS is dual-modal in that it can both measure biomass with high throughput and digitally identify single particles at high magnification without the need for labels.
As we have reviewed so far, various techniques can be used for particle quantification, but some methods show reduced sensitivity for small EVs.
- EV characterization methods
Just as counting the number of isolated EVs is important, it is also essential to perform quantitative and qualitative analyses of the biomolecules (nucleic acids, lipids, proteins) that make up EVs. In the following section, we will examine the key parameters that need to be evaluated and introduce techniques for their analysis.
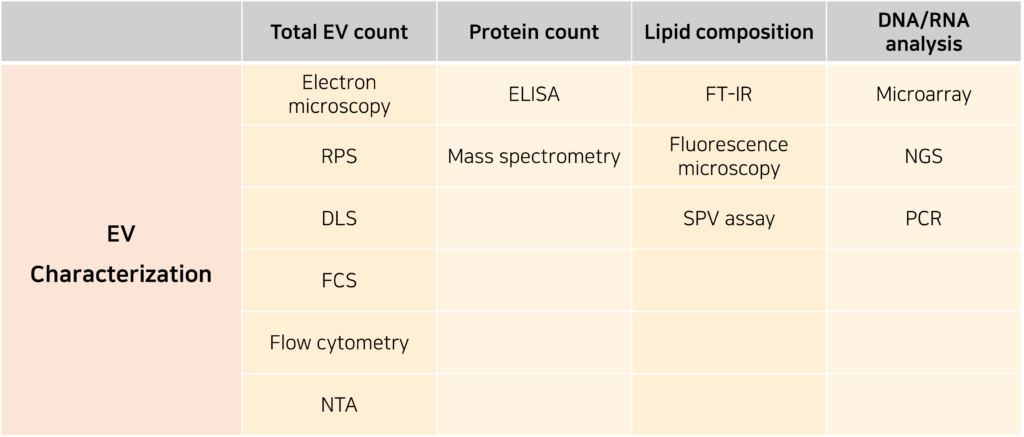
1) Total EV count
Methods for measuring particle count are used to calculate the yield of EVs and can be conducted using electron microscopy, RPS, DLS, fluorescence correlation spectroscopy (FCS), flow cytometry, and NTA. FCS, flow cytometry, and NTA are the most commonly used techniques, whereas DLS and RPS tend to overestimate particle counts, leading to lower reliability.
2) Protein content
The purity of EVs can be assessed by analyzing the total protein content present in the sample. The purity of an EV sample can be determined by calculating the total protein amount relative to the total EV count. The protein markers of EVs can be detected using enzyme-linked immunosorbent assay (ELISA) or mass spectrometry (MS).
MS is an instrument that effectively analyzes substances by measuring the mass-to-charge ratio of ions, even in complex mixtures. To prevent degradation or denaturation of EV components during analysis, minimal sample preparation is required when using MS for EV protein analysis. EV-specific proteins are comprehensively analyzed using MS and bioinformatics.
ELISA is a more commonly used quantitative method for proteins and peptides, employing antibodies. ELISA enables quantification of EV protein markers, tumor antigens, and EV-specific antigens and has been used for EV profiling and diagnostics. Some protein markers can be analyzed cost-effectively using ELISA, while the quantification of proteins within complex biological samples can be achieved through MS.
3) Lipid composition
EVs can be classified into several subgroups based on the types of lipids they carry. From this perspective, the purity of EVs is evaluated by calculating the proportion of EVs containing the target lipid relative to the total EV count. Techniques for lipid composition analysis include Fourier Transform Infrared Spectroscopy (FT-IR), fluorescence microscopy, and the sulfo-phospho-vanillin (SPV) assay.
Lipid concentration can be measured using the SPV assay, which quantifies the coloration produced by the reaction between lipid carbocation, vanillin phosphate, and sulfuric acid. To directly visualize EV lipids, fluorescent dyes such as PKH26 or DiR, which are membrane-lipid-affinitive, can be used for staining followed by observation under a fluorescence microscope.
Compared to the SPV assay or fluorescence microscopy, FT-IR provides higher accuracy and reproducibility in lipid concentration analysis, with advantages in speed, cost, and sample requirements. However, FT-IR has reduced sensitivity for cholesterol and other sterol-based lipids, as their C-C or C-H vibrational bands can be easily disrupted by other compounds in the mixture.
4) DNA/RNA analysis
EVs can serve as transport vehicles for intercellular DNA/RNA exchange. The purity of EVs is evaluated by calculating the proportion of EVs carrying the target DNA/RNA sequences relative to the total EV amount. Commonly used techniques for EV nucleic acid analysis include microarray, next-generation sequencing (NGS), and polymerase chain reaction (PCR). Compared to NGS and microarray technology, PCR is the most fundamental analytical method due to its superior sensitivity and accuracy.
Here, we have summarized the profiles and techniques necessary for utilizing EVs as pharmaceuticals, dividing them into quantification methods and characterization analysis. While standardized quantification and analytical methods have not yet been established, the continuous advancements in analytical technologies are enabling more precise EV analysis. The key point is that, due to the complex composition and functions of EVs, a comprehensive analysis and evaluation must be conducted by applying various analytical methods based on different principles. To overcome stringent pharmaceutical regulations, we look forward to the commercialization of EV-based therapeutics through collaboration across various fields.
Reference : Miron RJ, Zhang Y. Understanding exosomes: Part 1-Characterization, quantification and isolation techniques. Periodontol 2000. 2024 Feb;94(1):231-256. doi: 10.1111/prd.12520.