
The use of packed-bed chromatography, employing columns filled with materials, is essential in the purification process of biological reagents such as monoclonal antibodies and viral vectors. In conventional chromatography columns, porous microspheres are packed into cylindrical columns and used for purification based on size, charge, and hydrophobicity. The packed bed and its constituent beads have a close association with the chemical/physical separation of the reagent.
The highly advanced high-resolution imaging technology allows for the analysis of their complex geometrical structures and features without the need for separate column disassembly or cutting. In this article, we will explore the structural characteristics of commercially available chromatography columns using techniques such as X-ray tomography.
X-ray tomography was employed to examine agarose, cellulose, and ceramic-based resins, with subsequent comparative analysis of porosity and tortuosity.
1. Packed-bed Imaging
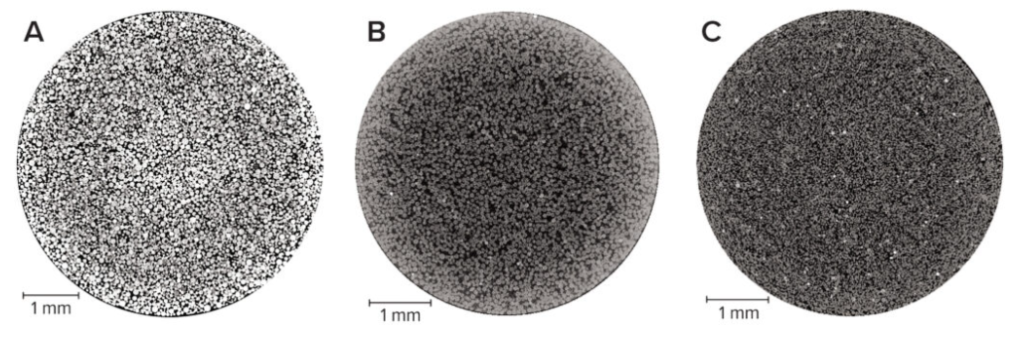
X-ray tomography was performed on unused packed columns, aiming to reveal the geometric structure of the resin in its most intact state. The following images depict the tomographic results of three different packed columns, clearly displaying distinct structural differences in the material. The agarose and cellulose resins appear spherical, whereas the ceramic particles exhibit a shape quite distinct from a perfect sphere.
Through Iodine Pulse Imaging, it is possible to analyze a radial packing disparity arises from geometric or frictional interactions with the inner wall of the column. When analyzing the porosity and tortuosity at the edge and center of the column using this technique, the results were as shown in the following chart. In terms of porosity, it was observed that the porosity at the edge of the column decreased at a similar rate for all three types of resin. However, the largest difference was observed in the cellulose resin.
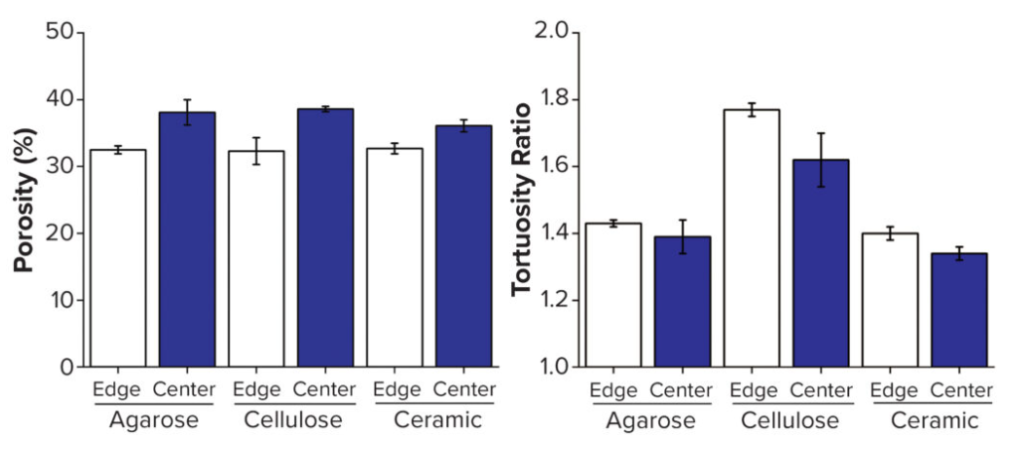
Tortuosity, which signifies the path length that the mobile phase travels through in chromatography, can be another crucial metric for evaluating column performance. In the past, tortuosity was indirectly measured, but with the advent of 3D imaging technology, simulations for tortuosity have become possible. According to the simulation results, it was analyzed that, for all three types of resin, the tortuosity at the center of the column was higher than at the edge. Similar to porosity, the largest difference in tortuosity between the center and the edge was observed in the cellulose resin.
2. Packed-Bed Compression
As the inner diameter of the column increases, the frictional support against the inner wall decreases. This leads to compression of the mobile phase containing foulants, especially in weaker resins like cellulose. To replicate this artificial compression scenario, we conducted experiments by passing 20% ethanol through a 1 ml packed column at a normal flow rate of 1 CV/min and an excessive flow rate of 10 CV/min. As shown in the following figure, when the mobile phase was passed at an excessive flow rate, the resin in the column became separated from the plastic inner wall and compressed.
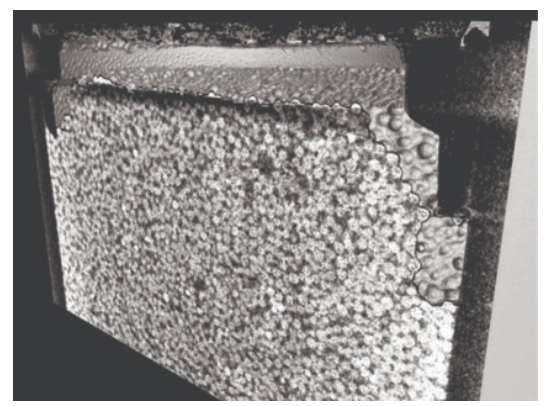
We collected 3D imaging data like the above image and measured the porosity and tortuosity of the compressed packed column. The analysis data of the imaging before, during, and after the passage at normal and excessive flow rates is presented in the following chart.
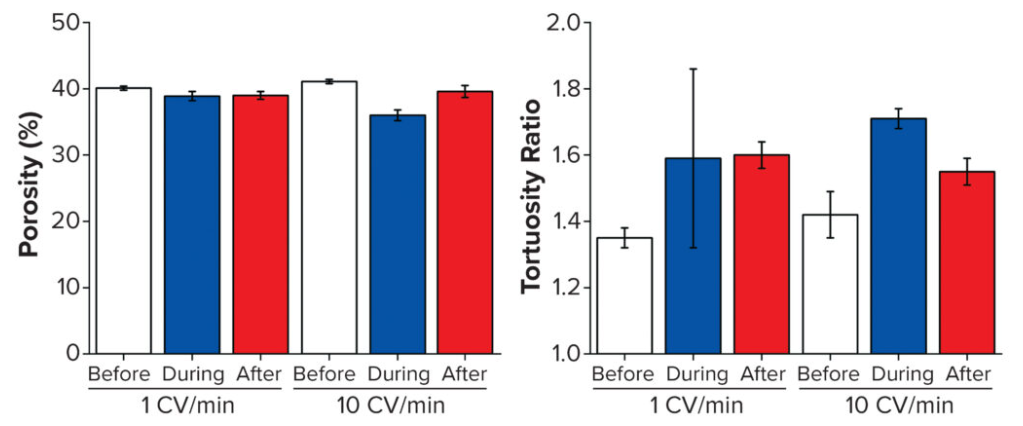
Figure 4. Structural analysis of three resins before, during, and after flow-induced compression (Left Porosity, Right Tortuosity)
The experimental results showed that there was no noticeable change in porosity at a normal flow rate. However, during the passage at an excessive flow rate, a significant reduction in porosity was observed. This phenomenon was found to revert to its original state when the flow of the mobile phase stopped. Additionally, tortuosity also decreased under excessive flow rate, and to a certain extent, it was restored when the flow of the mobile phase ceased.
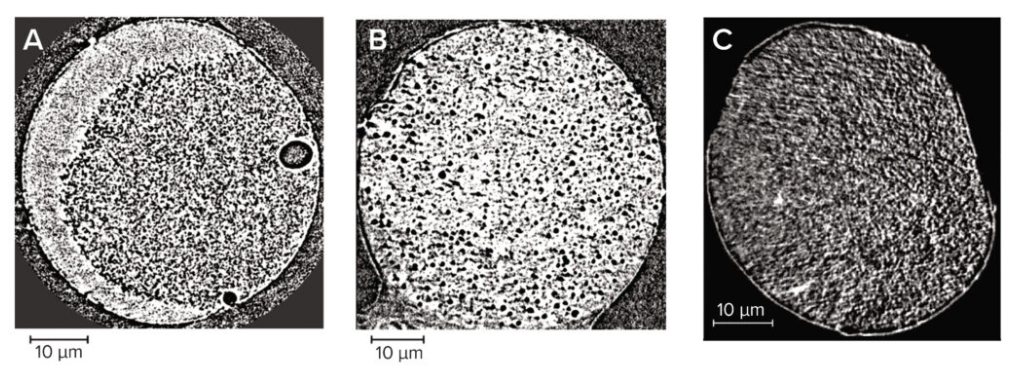
3. Individual Bead Imaging
The internal structure of the resin is a crucial consideration in size-exclusion chromatography for separation and purification. It also provides essential information for calculating surface area, which is necessary for predicting resin binding capacity for substances or impurities. Images confirming the internal structure of the three types of resin particles through X-ray tomography are depicted in the following picture. Porosity is evident in each type of resin, affirming their distinct three-dimensional structures.
Selecting the appropriate column based on the physical and chemical properties (such as size, charge, hydrophobicity, etc.) of the biological reagent to be separated is a crucial factor in process design. As seen in the above analysis, there are differences in the three-dimensional structures depending on the type of resin used to fill the column. This leads to variations in porosity and tortuosity, which in turn affect the purity or the physical/chemical properties of the biological reagent being purified. Ultimately, this can also impact the efficacy of the produced drug, underscoring the need for careful column selection.
Reference : Visualization and Characterization of Chromatography Structures: Imaging at Packed-Bed and Individual-Bead Scales (https://bioprocessintl.com/2023/october-2023-2023/visualization-and-characterization-of-chromatography-structures-imaging-at-packed-bed-and-individual-bead-scales/)